An ecomap is a simple diagram that shows a person or family at the center and maps the relationships around them, such as friends, school, work, healthcare, and community groups. Social workers, counselors, and students use ecomaps to understand support systems and stress points at a glance.
This page offers 8 free ecomap templates you can download, print, and fill in. You will also find a clear guide on how ecomaps work, how to draw one step by step, and how an ecomap differs from a genogram.
What Is an Ecomap?
An ecomap (sometimes called an eco-map or ecogram) is a visual tool that places an individual or family in the middle of a circle and connects them to the people, groups, and organizations in their environment. Lines between the center and each outer circle show the type and strength of each connection. Dr. Ann Hartman, who also created the genogram, developed the ecomap in 1975 for use in child welfare and family social work.
Ecomap vs. Genogram
The two tools are often used together but show different things. A genogram maps family history and biological or legal relationships across generations. An ecomap maps a person’s current social and community connections. Use a genogram to understand family patterns and an ecomap to understand outside support and stress.
Benefits of Using Ecomap Templates
- Visual clarity: Complex social networks become easy to read at a glance.
- Faster assessments: A ready template saves you from drawing circles and lines by hand.
- Better case plans: Seeing which resources are strong or missing helps guide interventions.
- Client involvement: Clients can help fill in their own ecomap, which supports open conversation.
- Consistent documentation: A standard layout makes files easier to review and share.
What to Include in an Ecomap
- A central circle for the person or family
- Outer circles for systems such as school, work, church, health care, friends, extended family, and social services
- Connecting lines showing the strength of each relationship
- Arrows showing the direction of energy or resources
- A key or legend explaining line types
- Date and the name of the person who completed it
Line Types Commonly Used
| Line style | Meaning |
|---|---|
| Solid, thick line | Strong connection |
| Dotted or dashed line | Weak or tenuous connection |
| Line with slashes | Stressful or conflicted connection |
| Arrow | Direction of resources or energy |
Note: Ecomaps contain personal information. Follow your organization’s privacy and confidentiality rules when storing or sharing them.
Free Ecomap Templates
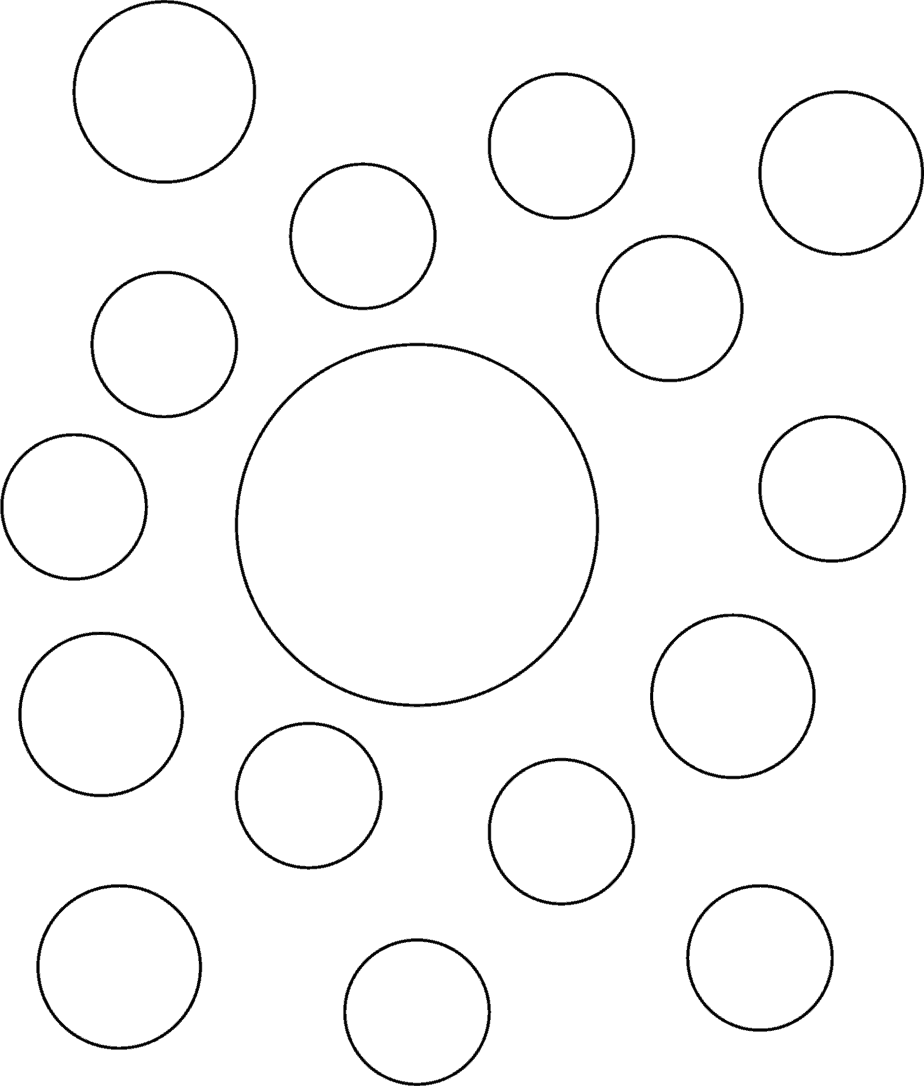
Basic Ecomap Template (PDF)

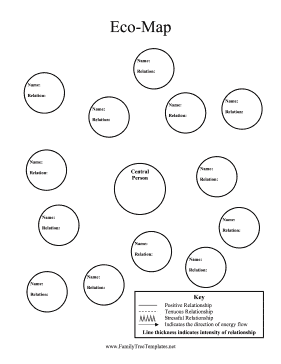
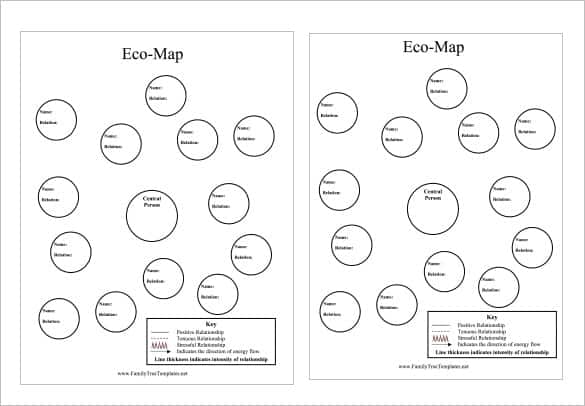
Eco-Map Template (PDF)
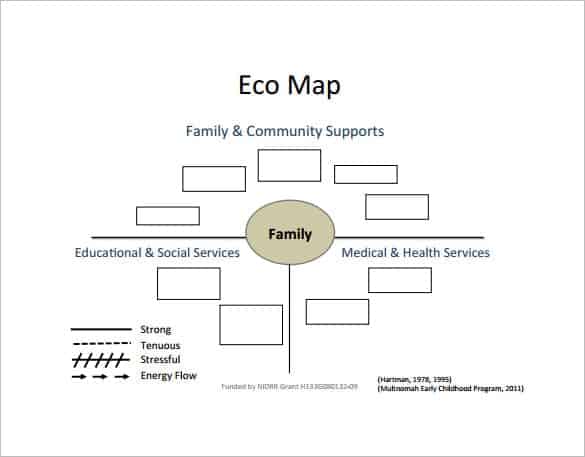
Ecomap Template with Family Systems (PDF)
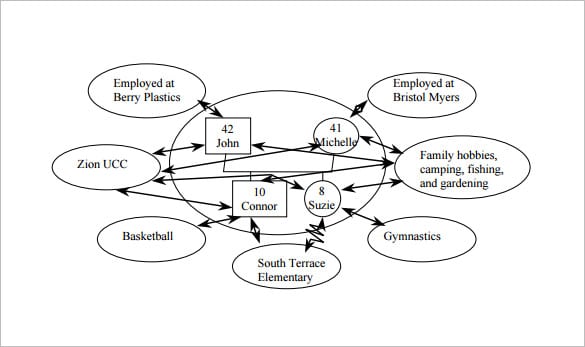
Ecomap and Genogram Instructions (PDF)
Ecomap Template (Online Tool)
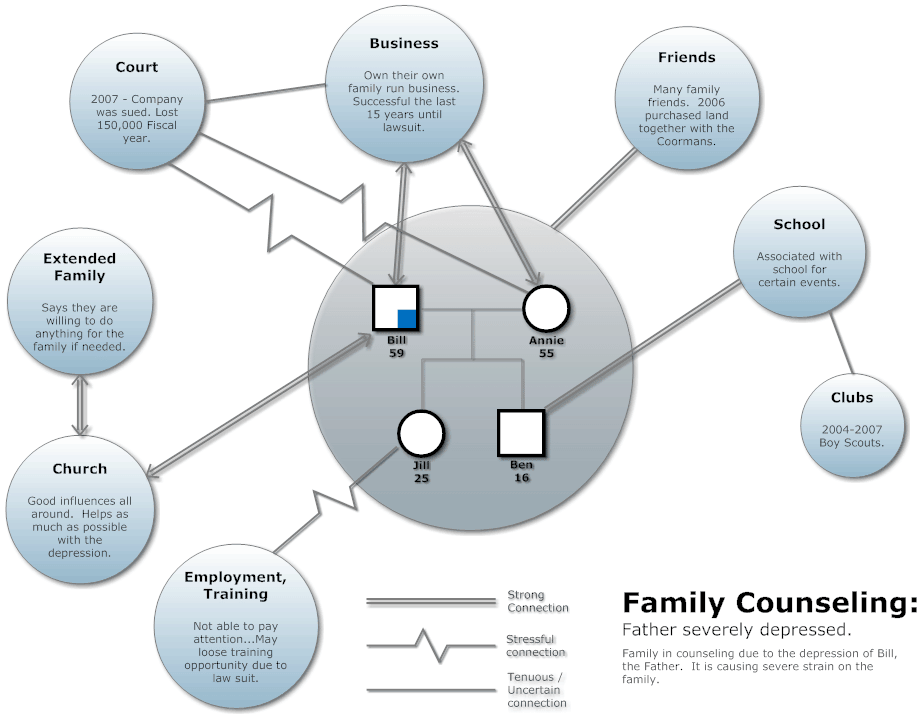
More Ecomap Examples
Ecomap Example 1
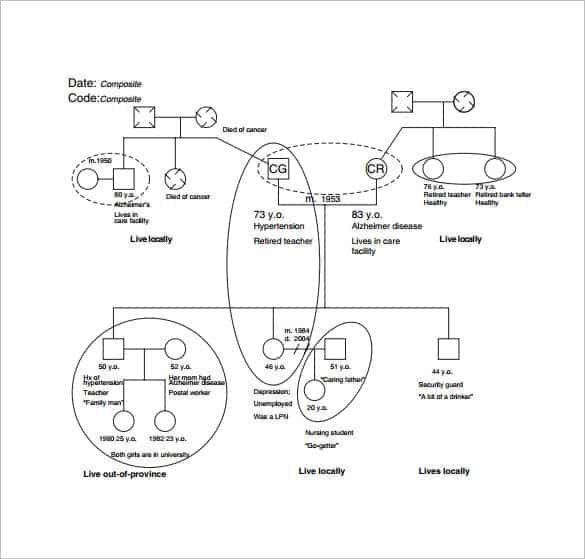
Ecomap Example 2
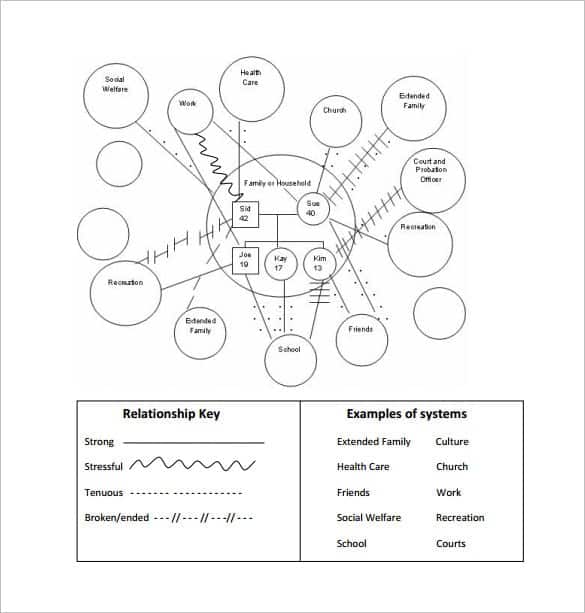
Ecomap Example 3
How to Make an Ecomap Step by Step
- Draw or choose a template. Start with a central circle for the client or family.
- Name the center. Write the person’s name or list household members inside.
- Add outer circles. Label each with a system, such as school, employer, health care, faith community, or friends.
- Connect the circles. Draw solid, dotted, or slashed lines to show the strength of each connection.
- Add arrows. Show whether resources flow toward the client, away, or both ways.
- Review with the client. Ask whether the map feels accurate and what they would like to change.
- Record and date it. Save the ecomap in the case file and update it as circumstances change.
Tips for Effective Ecomaps
- Use a pencil first so you can adjust as you talk with the client.
- Keep labels short and specific.
- Include both supportive and stressful connections.
- Redo the ecomap periodically to track progress.
- Print on letter or A4 paper with enough space for notes.
Frequently Asked Questions (FAQs)
What is an ecomap used for?
It is used to show a person’s or family’s relationships with the wider community, helping professionals assess support systems, stressors, and gaps in resources.
Who uses ecomaps?
Social workers, family counselors, school counselors, nurses, and students in human services programs use them regularly.
What is the difference between an ecomap and a genogram?
A genogram shows family relationships and history across generations. An ecomap shows current connections between the person and outside systems.
Who invented the ecomap?
Dr. Ann Hartman developed the ecomap in 1975, the same social work scholar who created the genogram.
Can I make an ecomap in Word or by hand?
Yes. You can print a template and fill it in by hand, or recreate the circles and lines with shapes in Word or PowerPoint.
What do the different lines mean?
Solid lines usually show strong ties, dotted lines show weak ties, and slashed lines show stress or conflict. Always include a key so others can read your map.
How often should an ecomap be updated?
Update it whenever the client’s situation changes, and review it at regular case reviews.
Final Thoughts
An ecomap is one of the most practical tools for understanding a client’s world. Pick a template from the list above, print it, and start mapping connections in minutes.
You must be logged in to post a comment.